Resilient airports deliver growth with fuller planes
- Heathrow sets fifth consecutive monthly traffic record, up 4.3%
- BAA group traffic up 1.0%
- Strong long-haul growth to North America, China and India
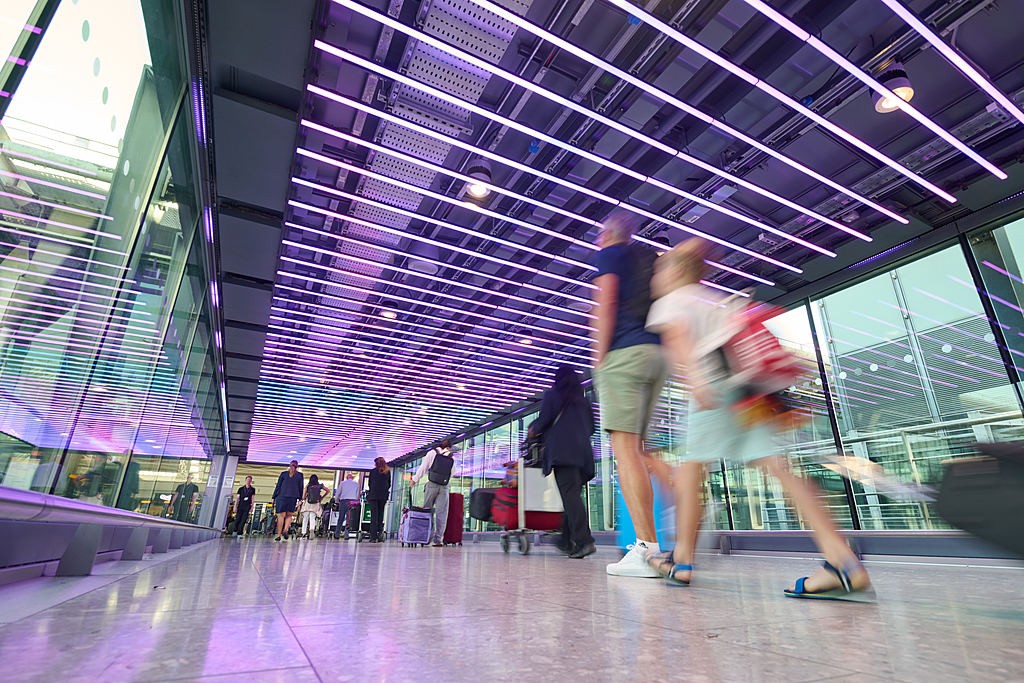
Passenger traffic at Heathrow grew 4.3 percent during November against the same month last year, leading to a fifth consecutive record month.
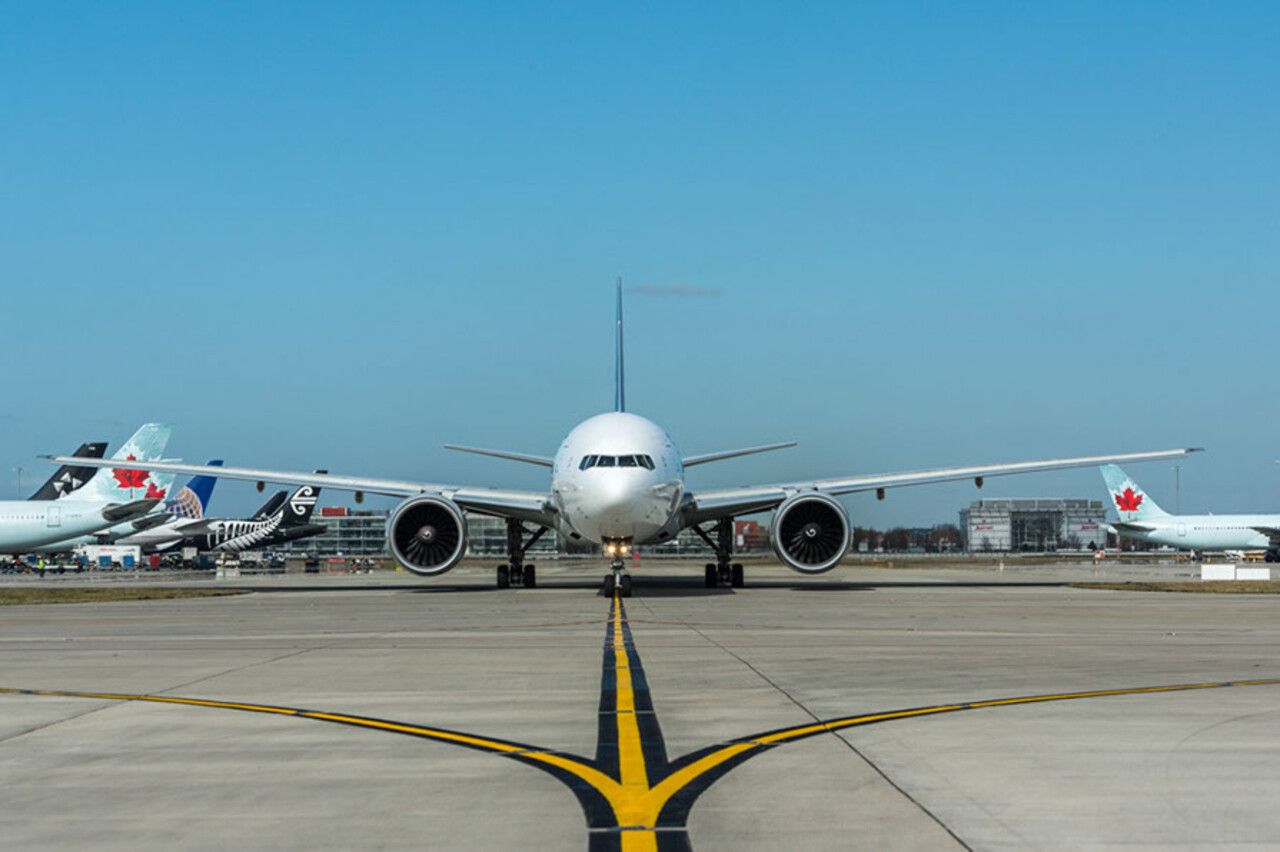
The aviation industry has continued its efficiency drive with a continuing rise in load factors – showing how full planes are – at Heathrow (up 1.0 percent) to 71.7 percent and at group level (up 1.3 percent) to 72.1 percent.
However, fog, snow and strong winds across the UK and Northern Europe hit passenger numbers by around 130,000 across BAA's six airports. Without the bad weather, the underlying result would have been an increase of 2.7 percent.
At Heathrow, domestic traffic was up 3.2 percent, while European scheduled traffic rose 7.5 percent. North Atlantic services carried 4.4 percent more passengers and other long haul routes recorded a collective increase of 2.1 percent. China (including Hong Kong) rose by 9.7 percent and India increased 5.3 percent, reflecting how important these links are to securing the UK's economic future.
As a whole, BAA's airports handled 7.9 million passengers during November, up 1.0 percent compared with the same period last year. Domestic traffic was the only major market to see a decrease, down 3.6 percent due mainly to weather disruption.
A reduction in low-cost airline capacity was the main factor behind the drop of 7.6 percent at Stansted, while at Southampton most of the 3.2 percent decrease can be attributed to the adverse weather late in the month.
Without the severe weather in Scotland and elsewhere, Glasgow would have reached last year's November total. However, as a result of the snow, volumes fell by 0.8 percent. Snow disruption was worst in the east of Scotland, and Edinburgh (down 3.9 percent) lost at least 50,000 passengers while Aberdeen (down 1.9 percent) lost around 15,000.
Cargo tonnage at Heathrow rose by 3.7 percent and for the group as a whole it was up by 2.8 percent, indicating that the global economic recovery is continuing as retailers ready their warehouses and stores for the Christmas rush.
Business commentary and outlook
Heathrow’s resilience in performing well despite the poor weather shows how well prepared it has been and also reflects strong demand for long-haul travel. Because business travellers make up a third of its passengers, with more than half living outside the UK, Heathrow is less reliant on the British consumer sector and performs in line with the broader international economic environment and UK export sector which continues to improve.
Conversely, the recovery in leisure traffic elsewhere has remained subdued, in part because of carriers relocating to foreign bases.
Colin Matthews, chief executive of BAA, said:
“It has been a tough month for passengers with the worst snow for decades but people understand that safety comes first. We have invested in winter preparations and have worked around the clock to keep our airports running. But it is not just about clearing snow, it’s also about landing and take-off rates and weather at destination airports. Heathrow and Stansted have remained open throughout, but elsewhere and across Europe some airport closures were inevitable.
“Despite a further increase in passengers at Heathrow we have kept queues¹ down, returned people's bags quicker² and improved passengers’ journeys.
“Heathrow's £5 billion investment programme continues, modernising Terminal 3 and building a brand new Terminal 2 - the biggest private development in the country. We have a long way to go but real progress has been made in cutting queues, improving service and upgrading the older terminals.
“Airlines are benefiting from the improving economic climate and from having fuller aircraft, allowing us to make better use of the scarce resources we have at Heathrow. We're adjusting our landing charges to further incentivise greener, more efficient aircraft to benefit the industry, passengers and local community.
"On-going strong performance at Heathrow shows that the global recovery continues as we head towards Christmas and into the New Year.”
BAA traffic summary: November 2010
| Terminal passengers (000s) | Month | % change | Jan to Nov 2010 | % change | Dec 2009 to Nov 2010 | % change |
|---|---|---|---|---|---|---|
| Heathrow | 5,243.2 | 4.3 | 60,938.0 | 0.6 | 66,254.1 | 0.6 |
| Stansted | 1,212.3 | -7.6 | 17,346.5 | -6.7 | 18,713.1 | -6.4 |
| London area total | 6,455.5 | 1.8 | 78,284.5 | -1.1 | 84,967.3 | -1.0 |
| Southampton | 127.0 | -3.2 | 1,641.8 | -1.8 | 1,760.5 | -2.1 |
| Glasgow | 485.2 | -0.8 | 6,167.8 | -9.2 | 6,592.6 | -9.2 |
| Edinburgh | 622.1 | -3.9 | 8,123.9 | -4.1 | 8,703.9 | -4.1 |
| Aberdeen | 226.2 | -1.9 | 2,579.7 | -7.4 | 2,794.9 | -7.5 |
| Scottish total | 1,333.5 | -2.4 | 16,871.4 | -6.5 | 18,091.5 | -6.5 |
| UK total | 7,916.0 | 1.0 | 96,797.7 | -2.1 | 104,819.2 | -2.0 |
| Naples | 370.6 | 7.0 | 5,179.2 | 4.9 | 5,533.5 | 5.5 |
| Air transport movements | Month | % change | Jan to Nov 2010 | % change | Dec 2009 to Nov 2010 | % change |
|---|---|---|---|---|---|---|
| Heathrow | 38,004 | 2.6 | 416,739 | -1.5 | 453,660 | -1.4 |
| Stansted | 9,802 | -11.7 | 133,446 | -8.1 | 144,469 | -7.7 |
| London area total | 47,806 | -0.7 | 550,185 | -3.2 | 598,129 | -3.0 |
| Southampton | 3,028 | -2.2 | 38,123 | 0.8 | 40,859 | 0.1 |
| Glasgow | 5,633 | 3.7 | 65,019 | -6.2 | 69,979 | -6.6 |
| Edinburgh | 7,609 | -4.8 | 95,151 | -4.7 | 102,404 | -5.1 |
| Aberdeen | 7,280 | -6.3 | 83,707 | -6.6 | 90,931 | -6.8 |
| Scottish total | 20,522 | -3.2 | 243,877 | -5.7 | 263,314 | -6.1 |
| UK total | 71,356 | -1.5 | 832,185 | -3.8 | 902,302 | -3.8 |
| Naples | 4,379 | -1.5 | 59,289 | -1.1 | 63,392 | -0.8 |
| Cargo (metric tonnes) | Month | % change | Jan to Nov 2010 | % change | Dec 2009 to Nov 2010 | % change |
|---|---|---|---|---|---|---|
| Heathrow | 127,961 | 3.7 | 1,364,171 | 17.8 | 1,484,379 | 18.0 |
| Stansted | 17,461 | -1.6 | 186,582 | 11.2 | 202,459 | 11.4 |
| London area total | 145,422 | 3.0 | 1,550,752 | 17.0 | 1,686,839 | 17.1 |
| Southampton | 22 | 16.6 | 114 | -39.8 | 134 | -34.0 |
| Glasgow | 349 | 119.0 | 3,411 | 36.8 | 3,630 | 34.4 |
| Edinburgh | 1,658 | -19.7 | 19,316 | -12.4 | 21,332 | -7.0 |
| Aberdeen | 404 | 19.0 | 4,723 | 3.3 | 5,072 | 4.5 |
| Scottish total | 2,411 | -6.0 | 27,450 | -5.7 | 30,033 | -1.5 |
| UK total | 147,855 | 2.8 | 1,578,317 | 16.5 | 1,717,006 | 16.8 |
| Naples | 114 | -32.7 | 1,715 | -8.4 | 1,829 | -7.5 |
Market comparison – UK airports November 2010
| Market | BAA total Nov 2009 (000s) | BAA total Nov 2010 (000s) | % change |
|---|---|---|---|
| UK & Channel Islands | 1,545.2 | 1,490.3 | -3.6 |
| Ireland | 364.8 | 351.8 | -3.5 |
| European scheduled | 3,101.2 | 3,169.3 | 2.2 |
| European charter* | 76.4 | 81.2 | 6.2 |
| North Atlantic | 1,057.5 | 1,103.5 | 4.3 |
| Other long haul | 1,693.1 | 1,719.9 | 1.6 |
| Total | 7,838.2 | 7,916.0 | 1.0 |
* Includes North African charter
Note: Origins and destinations are classified according to ultimate origin or destination of aircraft in the case of multi-sector flights.
Note: Figures for the market sectors have been rounded. Totals as per Traffic Summary.
Notes to editors:
For the first nine months of 2010 Heathrow passengers passed through security in less than five minutes 97.9 percent of the time.
In October, baggage arrived on carousels on average 34 minutes after the plane touched down. This is one minute ahead of our target of 35 minutes, and three minutes quicker than our 2009 figure of 37 minutes.
Further information from: Heathrow Airport media relations, 020 8745 7224


