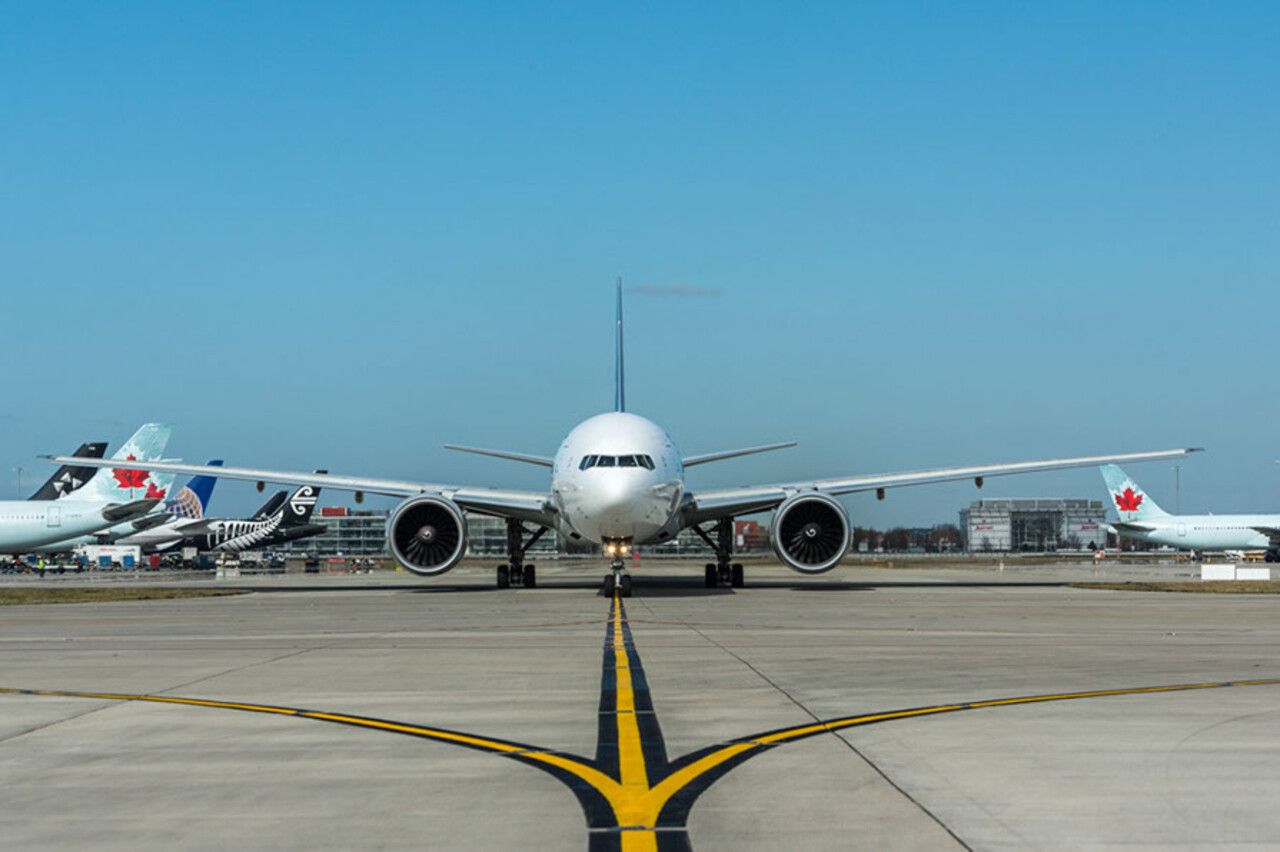
- We have seen the largest rise in passenger numbers of any European airport in the last year. Over 6 million people travelled through Heathrow in July and an estimated 16 million are expected between July and September.
- The cap on departing passenger numbers has delivered improvements to passenger experience, with fewer last minute flight cancellations, better aircraft punctuality and baggage delivery.
- Integral to increasing the departing passenger cap is increasing airline ground handler capacity and resilience, and we have initiated a review of ground handling to support that objective.
- Recruitment for this summer’s getaway began last November, and we have hired an additional 1,300 recruits. Security resource is back at pre pandemic levels, enabling 88% of Heathrow passengers to clear security within 20 minutes or less.
- Border Force has performed well so far this summer and we are working to help them secure sufficient resource to serve the peak in passengers returning to the UK over the next few weeks.
Heathrow CEO John Holland-Kaye said: “Passengers are seeing better, more reliable journeys since the introduction of the demand cap. I want to thank all my colleagues across the airport for their amazing work in getting people away on their holidays. This has only been possible because of the collective and determined efforts of airport, airline and wider Team Heathrow teams.”
July 2022 | |||||||
Terminal Passengers | Jul 2022 | % Change | Jan to | % Change | Aug 2021 to | % Change | |
Market |
|
|
|
|
|
| |
UK | 265 | 58.4 | 1,873 | 194.7 | 3,006 | 176.9 | |
EU | 2,223 | 247.3 | 11,368 | 507.6 | 16,755 | 268.3 | |
Non-EU Europe | 414 | 233.1 | 2,465 | 469.1 | 3,569 | 258.7 | |
Africa | 242 | 203.9 | 1,541 | 250.4 | 2,142 | 182.3 | |
North America | 1,755 | 656.5 | 7,964 | 1030.4 | 10,597 | 802.3 | |
Latin America | 155 | 327.3 | 950 | 956.5 | 1,272 | 555.1 | |
Middle East | 708 | 428.0 | 3,663 | 550.7 | 5,400 | 341.8 | |
Asia / Pacific | 550 | 465.5 | 2,561 | 311.5 | 3,677 | 208.6 | |
Total | 6,312 | 317.8 | 32,384 | 504.3 | 46,418 | 315.6 | |
Air Transport Movements | Jul 2022 | % Change | Jan to | % Change | Aug 2021 to | % Change | |
Market |
|
|
|
|
|
| |
UK | 2,026 | 16.2 | 15,551 | 111.9 | 25,427 | 107.5 | |
EU | 15,217 | 120.0 | 90,637 | 283.8 | 139,581 | 158.0 | |
Non-EU Europe | 2,751 | 141.5 | 18,764 | 280.7 | 28,268 | 169.7 | |
Africa | 1,042 | 58.4 | 7,763 | 89.9 | 11,561 | 64.3 | |
North America | 7,484 | 196.9 | 40,163 | 146.2 | 58,625 | 115.7 | |
Latin America | 637 | 113.0 | 4,333 | 306.1 | 6,423 | 193.6 | |
Middle East | 2,370 | 72.7 | 14,037 | 70.0 | 22,822 | 57.1 | |
Asia / Pacific | 2,492 | 44.1 | 15,203 | 26.6 | 26,162 | 22.7 | |
Total | 34,019 | 107.7 | 206,451 | 166.0 | 318,869 | 113.9 | |
Cargo | Jul 2022 | % Change | Jan to | % Change | Aug 2021 to | % Change | |
Market |
|
|
|
|
|
| |
UK | 35 | 81.6 | 92 | -26.6 | 187 | 16.6 | |
EU | 8,057 | -21.9 | 62,210 | -12.6 | 112,250 | 2.8 | |
Non-EU Europe | 3,024 | -39.0 | 22,723 | -41.5 | 51,462 | -19.7 | |
Africa | 5,864 | 5.9 | 49,919 | 8.1 | 81,351 | 2.7 | |
North America | 43,175 | 8.4 | 315,396 | 19.4 | 532,917 | 26.6 | |
Latin America | 3,845 | 70.0 | 23,387 | 115.6 | 36,031 | 33.5 | |
Middle East | 20,744 | 11.1 | 132,107 | 2.5 | 231,777 | 5.3 | |
Asia / Pacific | 25,299 | -25.0 | 192,497 | -12.5 | 374,906 | 2.9 | |
Total | 110,044 | -4.6 | 798,331 | 2.3 | 1,420,881 | 10.6 | |


